A Handy Guide for Creating Flowcharts
cioreviewindia Team | Tuesday, 31 August 2021, 09:04 IST
 Are you having difficulties in making your employees understand an important process in the workplace? Don’t know where and how to start explaining?
Worry no more because we’ve got your back! We’ve provided you with a handy-dandy guide that will help you create a flowchart. If designed and constructed properly, this may just be the answer to your problems.
What Is a Flowchart and What Is It Meant For?
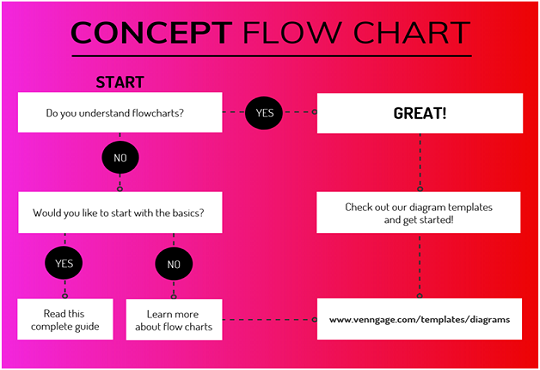
Businesses should continue to explore different tools to make a better, more efficient workforce. A flowchart is one of the most used tools when one wants to streamline a process in any setting (e.g. medical services, cooking procedure, travel itinerary). It is a graphical or symbolic representation of a process that helps you communicate large data in a concise, more digestible manner. With its aid, explaining complex processes to your organization becomes easier even at first glance.
Flowcharts are meant to break down big ideas into bite-sized information using symbols and diagrams. Just use the right words and simple symbols, and you’ll end up presenting a visually pleasing flowchart that would explain each stage in a process and the essential relations between them.
When Should I Use a Flowchart?

A good percentage of our population is considered to be visual learners. Visual learning is known to be the most common learning style. Let’s admit it. We understand things better when we are presented with visuals (diagrams, pictures, etc.).
Just like any type of visual representation, flowcharts can be used in schools, businesses, factories, manufacturing, and many other industries. Basically, you should opt to use a flowchart when you want to highlight particular procedures step by step.
Here are some examples of instances when to draw a flowchart:
- When you are documenting and trying to comprehend a process
Flowcharts help organize your business’s process. Organized processes = organized thoughts.
- When you study a process for improvement and development
With flowcharts, areas for improvement can be easily seen. You can later on come up with the perfect project plan.
- When you want to avoid miscommunication
Flowcharts make information visible to every stakeholder that needs to see it. This guides them to be productive at work as it reminds them of their role in the organization.
There are countless variations and versions of a flowchart. All of them are considered great for describing procedures such as business and manufacturing processes, organizational functions, and departmental interrelations.
How Do I Create a Flowchart?

Typically, people just use any shape, connect them with lines or arrows, and voila! You just made a flowchart! But it’s not as easy as one, two, three as everyone likes to think. There are also some instances when we come across confusing flowcharts. Instead of making things easier for us, we end up becoming even more confused trying to figure out the idea it wants to convey. To avoid that, keep these points in mind when creating a flowchart:
- Establish the purpose of creating the flowchart.
- Determine the signs, symbols, and other figures to use.
- Create a draft outline.
- Design the flowchart.
Flowchart Makers

If you are new to designing charts and graphs, there is no need for you to worry. Making a free-flowing chart is now made easy by flowchart creators. Investing in professional infographics designers like these will help your business grow as you develop effective communication with your stakeholders:
- Venngage
Venngage provides plenty of interesting and creative flowchart templates for subscribers to choose from. In just a matter of minutes, your flowchart is ready to go. Don’t forget to play around with lines and shapes to make your chart even more engaging!
- Adobe Spark
Adobe Spark features an online pie chart tool that makes creating flowcharts easy, especially for newbies in the field. They transform your collected data into a beautiful and more comprehensible chart.
- Google Sheets
Creating a flowchart using Google Sheets is simple and free. Just input your data in the spreadsheets and the system will automatically create a chart for your selected cells.
Indeed, a flowchart is a powerful business tool that could help you communicate processes in a very effective and efficient manner. Never hesitate to run to online diagram creators for help. Just click here and you’re on your way to creating your own flowchart.


